MintScript Learn
Trading Ranges: Stop Taking the Middle
Define boundaries before you trade. Middles kill R:R. Failed breakouts and break-and-hold scenarios need different plans — and neither is automatic.
A range is a working map A chart can be sideways without offering a useful range trade. You need boundaries clear enough to define invalidation and enough space between them to justify the risk.
For a teaching convention, start with at least two separated reactions near each boundary and an intervening rotation. Mark zones rather than an exact pixel when reactions cluster across several prices. This is a classification rule for practice, not proof the next reaction will hold.
Avoid naming every range accumulation or distribution. Price oscillating inside boundaries doesn’t tell you who is building a position or what happens next.
The middle is where your plan gets vague Synthetic range: support 100, resistance 110, midpoint 105. If you buy at 105 with a stop at 99 and a target at 110, you risk six points for five before costs. The chart may still rise, but the proposed trade has poor geometry for a model requiring at least 2R.
Near 101, a rejection trigger with an executable stop at 99 changes that geometry: two points of risk, with the midpoint four points away. The location creates room. It doesn’t create a known probability of winning.
Midpoints can be useful objectives or management references. They aren’t mandatory turning points. Mark them to measure the trade, not to promise a reaction.
Three outcomes at the boundary Price can reject and rotate back inside. It can break out and hold beyond the boundary. Or it can break out, stall, and return inside. Plan for all three.
For this lesson, a failed upside breakout requires a close above the resistance zone followed by a close back below it on the selected timeframe. A short model then waits for a retest from inside that rejects. The stop belongs beyond the rejection structure, and the midpoint is a possible first objective.
That close-based rule intentionally differs from a wick-only deviation. Keep them separate in your notes. You can later compare their outcomes without mixing two different setups.
When the range trade becomes stale If price establishes above 110, pulls back to the old resistance, and holds, fading every new high assumes the range still controls price. That’s exactly what you need to reassess.
Acceptance here means a defined close outside plus a successful retest and follow-through under the example model. It doesn’t require knowing that every participant agrees. Predefine how many candles you will allow for the retest rather than extending the window indefinitely.
Repeated tests of a boundary can end in a break or another rejection. Don’t treat either outcome as inevitable. More informative questions are whether rebounds are getting smaller, whether price holds near the edge, and whether the eventual break finds follow-through.
Trade the space you actually have If you enter after the rejection has already traveled most of the way to the midpoint, the idea may be right while the entry is late. Skip or wait for a new setup. A target at the far edge doesn’t remove obstacles in between.
Record the initial boundaries, the exact failed-breakout rule, entry timing, and whether the range held or transitioned. Include the breakouts you refused to fade. Being selective is part of the method, not an excuse you add after a loss.
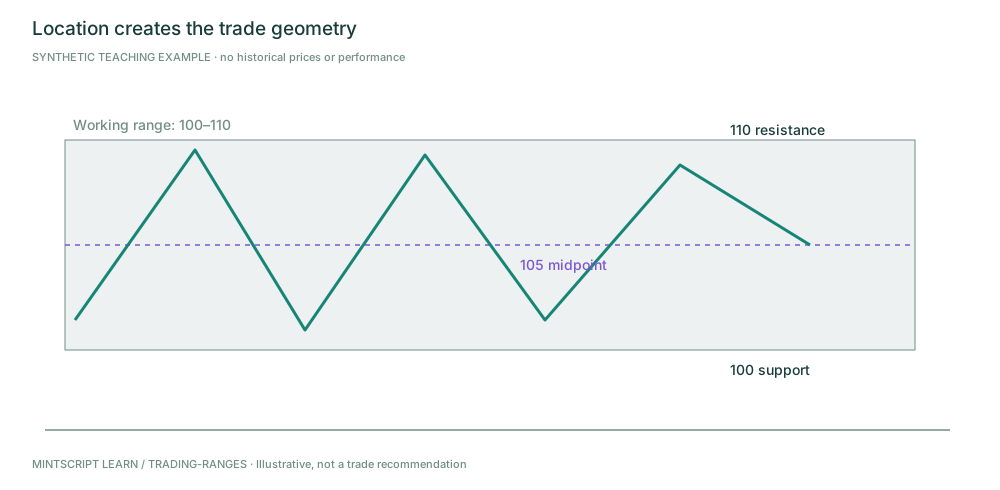
At the middle, the next boundary can be closer than your invalidation. Measure before entering.
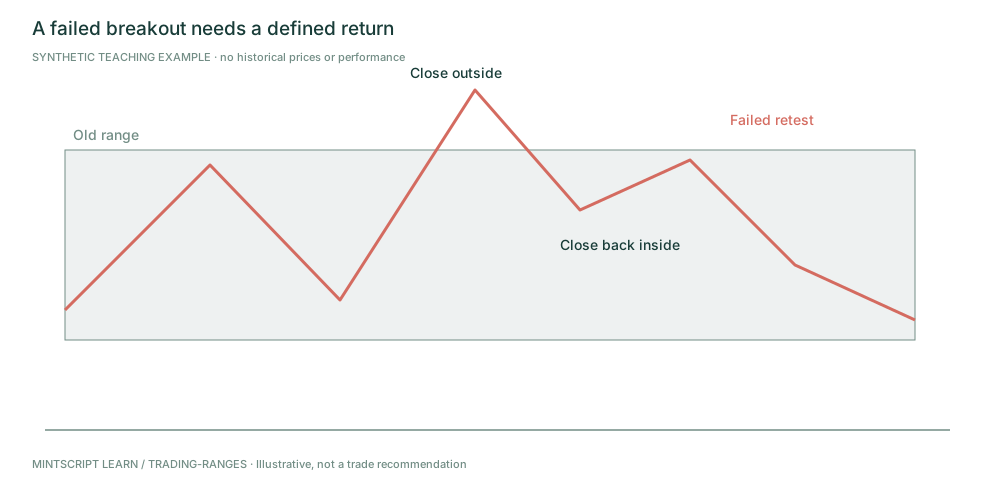
This example uses closes beyond and back inside, not the separate wick-only deviation rule.
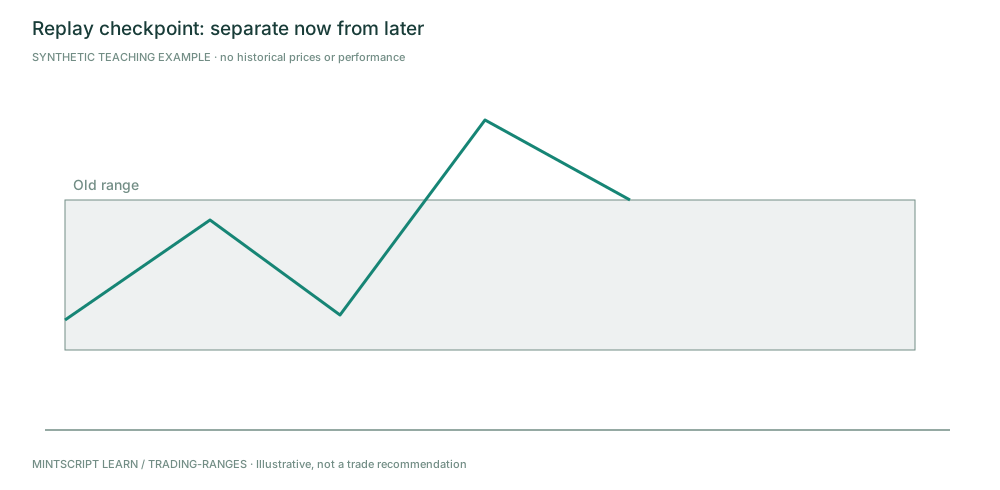
Hide the future. Describe what is known before revealing the later information.
Practice checkpoint
Range 100–110. Entry 105, stop 99, target 110. What is the planned reward-to-risk before costs, and does it meet 2R?
Worked answer (peek after you decide): Five points of reward divided by six points of risk is about 0.83R. It does not meet 2R. A correct directional view would not fix this entry geometry.
Source and editorial notes
Original MintScript Learn framework. All charts and numerical examples are synthetic teaching paths — not historical trades, backtests, or performance claims. SMC / indicator labels use the explicit conventions in this lesson; they are not standardized market facts. No win rates or “institutional order” claims are asserted.
Desk features referenced: Struct · FVG · VP · Heat · Markets · ATR stops.