MintScript Learn
Liquidity Sweeps vs Runs
The break alone isn’t the trade. Read the reaction — sweep vs run — with FVG clues, equal highs/lows, and desk overlays you already have.
Read what happens after the level breaks
You’ve seen it. Price takes a high, everyone starts talking about a breakout, and two candles later it’s heading the other way. Next time you fade the same move, it keeps going without you.
The break itself didn’t give you enough information. The reaction after it matters.
In this lesson we’re looking at two possibilities: a sweep, where price trades beyond a reference level and reverses; and a run, where price continues through it. At the moment of the break, either outcome is still possible. Your job is to collect evidence, define what would invalidate your idea, and leave the unclear ones alone.
Treat the FVG-overlap clues as hypotheses to test in replay — not established probabilities.
1. Start with a level you marked before the move
For this framework, mark a visible swing high or swing low. Previous day highs and lows, session extremes, and equal highs / equal lows are excellent reference points — Struct paints those pools on MintPro.
Above a high, there may be buy stops from shorts and breakout buy orders. Below a low, there may be sell stops from longs and breakout sell orders. A chart doesn’t show you every order waiting there. “Liquidity above the high” is shorthand for a possible concentration of orders, not a measurement of the order book.
Don’t mark every tiny pivot. Start with the obvious reference and ask: if this breaks, what would continuation look like? What would rejection look like?
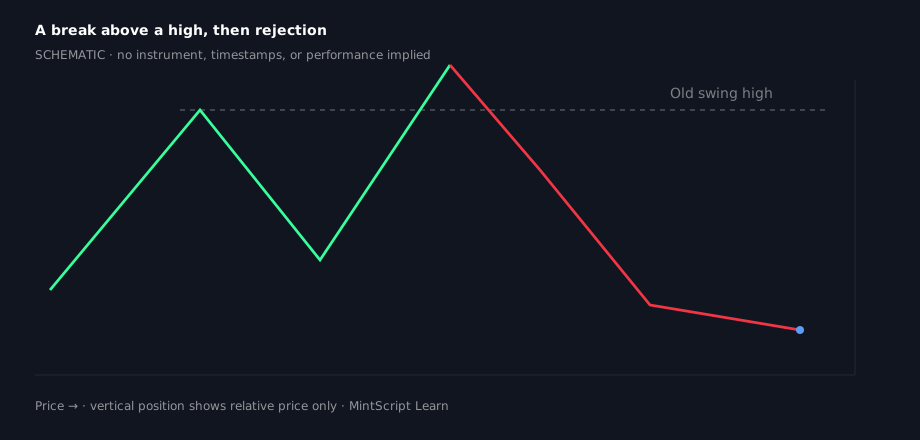
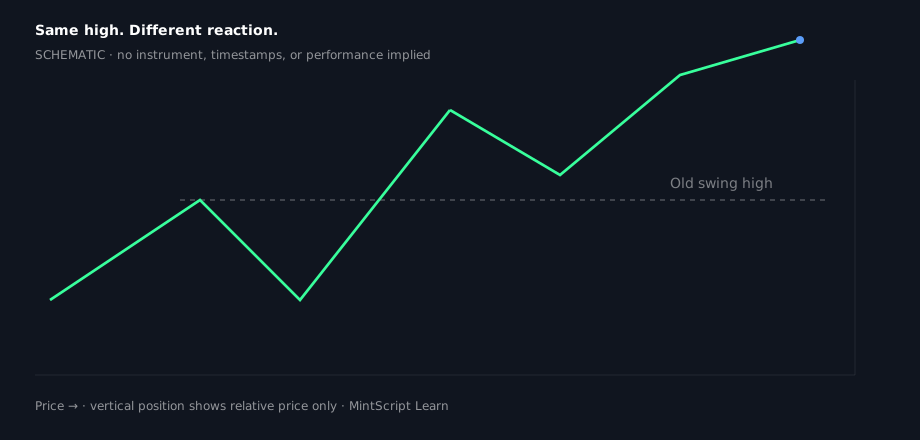
2. Sweep or run? Give price time to answer
A potential sweep above a high starts when price trades above it and comes back below. That reclaim of the old range is useful, but it doesn’t guarantee a larger reversal.
A potential run above a high starts with a break and follow-through. Stronger evidence appears when a pullback holds the breakout area and price pushes higher again. Below a low, flip the logic.
Here’s the part people rush: one wick above a line isn’t a complete short setup. One close above it isn’t a complete long setup either. Decide which candle close and which timeframe you’ll use *before* the move.
3. Get the FVG definition straight
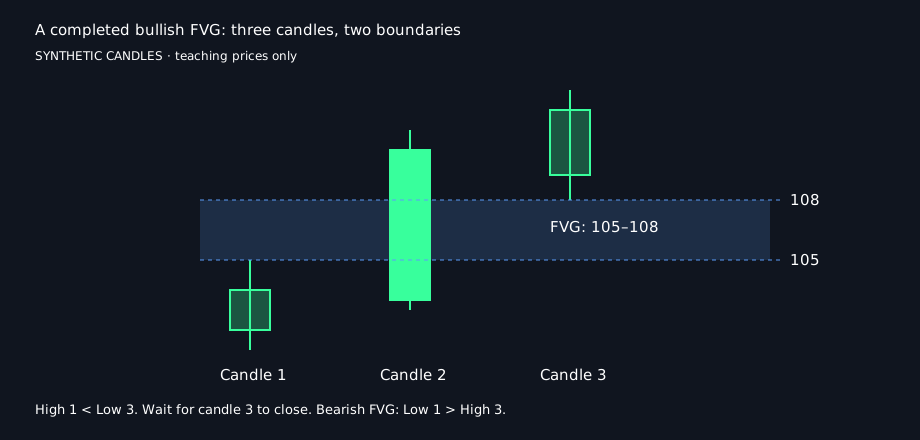
A fair value gap is a three-candle price pattern. For a bullish FVG, candle three’s low is above candle one’s high. The gap is the interval between those two prices. For a bearish FVG, candle three’s high is below candle one’s low.
Wait for candle three to close before calling the pattern complete. While it’s forming, the gap can shrink or disappear.
An FVG is a pattern in the displayed candles. It doesn’t prove institutional intent or guarantee a return to the zone.
And none of this is the same thing as a Volume Profile value area (VAH / VAL / POC). Keep your labels separate — Volume Profile lessons cover the auction map; FVG is candle geometry.
On MintPro: toggle FVG (Structure mode = BOS-linked gaps; All = ATR-sized open gaps).
4. The three clues worth watching
Clue one: does a *completed* FVG overlap the level that broke?
Clue two: does the pullback respect the structure supporting continuation?
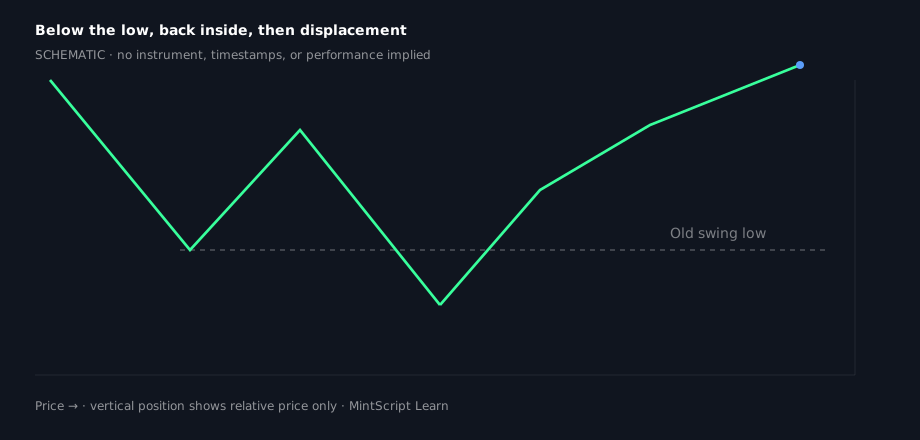
Clue three: do we get opposing displacement — a forceful move back through the broken level, with a completed opposing FVG or a break of a defined local swing?
My question here would be simple: do I still have a reason to expect continuation, or am I hanging onto the idea because I already wanted that trade?
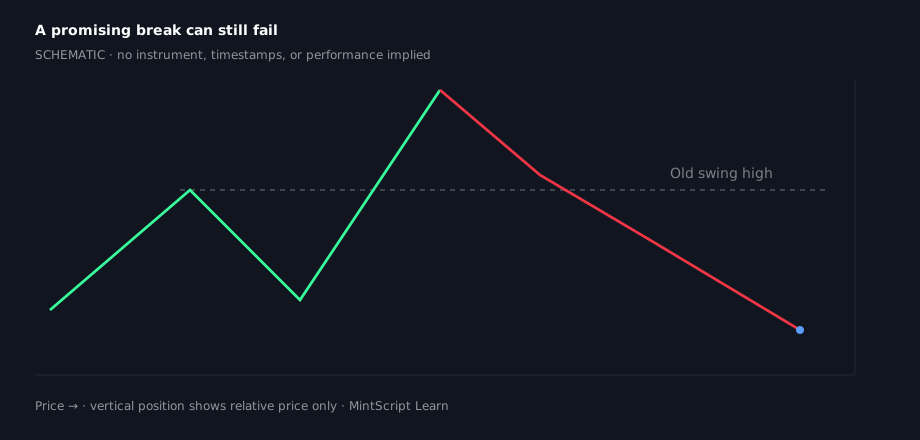
5. “Trapped traders” is a useful story — not proof
Imagine buying the breakout above a high. Price immediately comes back below it, then sells off hard. You’re holding a long against the move. That’s the situation people mean by trapped breakout traders.
Use the story to understand the setup. Use the price behavior to make the decision: reclaim, opposing displacement, failed retest, invalidation.
6. The sharp turn
A strong move in followed by a strong move out. Opposing FVGs can help identify a retracement area to watch — they don’t make every retest an entry.
A Balanced Price Range (BPR) here means overlap between opposing FVG zones. If there is no common price interval, don’t draw a BPR just because both gaps are nearby.
7. Higher timeframe context without the gymnastics
Start with the higher timeframe: where are price and the next meaningful reference levels? Then use a lower timeframe to inspect the reaction.
A practical pairing is 4H context with 1H confirmation. Those are examples, not mandatory ratios.
Keep one context TF and one confirmation TF while you learn this. If the 15-minute says no, dropping to the one-minute until you find a yes won’t make the original setup better.
Also useful on the desk: VP (POC / VAH / VAL) on the HTF window so you’re not treating every equal high like it’s the session’s real business. See ATR stops when you size the invalidation distance.
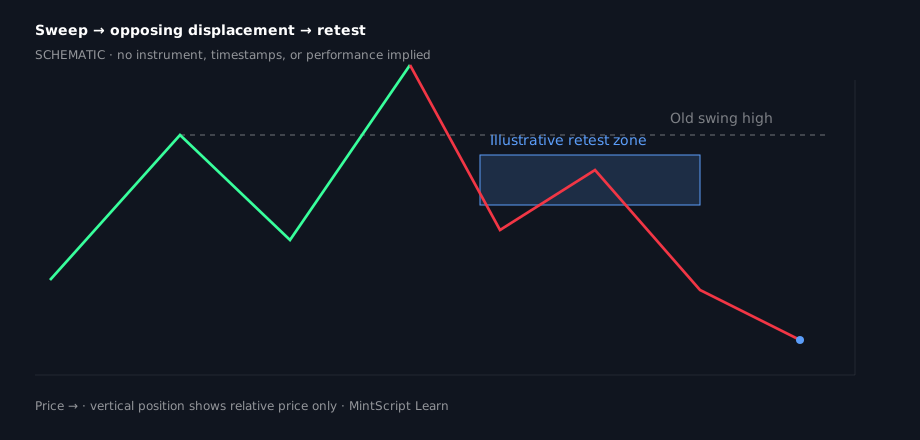
8. Entry model A — sweep, reversal, retest
Mark a swing high and a potential downside objective. Price trades above the high, then reclaims below. Wait for bearish displacement and a completed bearish FVG (or break of your chosen local swing). Watch the retest.
Define invalidation before entering. One approach: stop beyond the sweep extreme (spread + execution). Don’t switch stop logic because one R:R looks prettier.
Related primer: Inside the V3 Engine — how the desk thinks about structure and risk without dumping entry math.
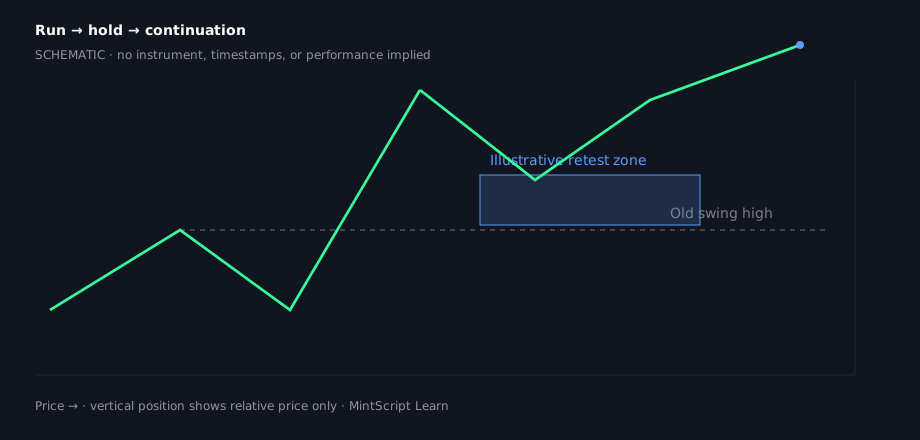
9. Entry model B — run, hold, continuation
Price breaks a marked high with follow-through. A completed bullish FVG overlapping the old high supports this template. Pullback into the predefined continuation area, hold, then your bullish trigger.
A break with no retest gives this model no entry. A pullback that cuts through the zone is a reason to reassess — not an obligation to flip.
10. Risk comes before being right
Pick a small, fixed risk limit for testing and size from the stop distance. A 2R target describes potential reward relative to initial risk — it doesn’t tell you the win rate.
Survive first. Profit second. Deeper stop math: Using ATR for smarter stops.
11. Replay it without cheating
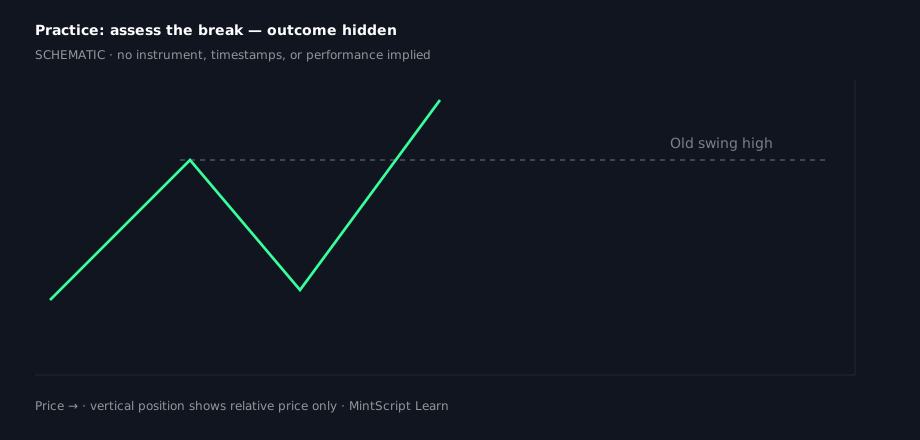
Hide the future candles. Mark level, context, confirmation TF, trigger, invalidation, and objective. Screenshot before advancing.
After the break write one of three things: continuation evidence, reversal evidence, or unresolved. You’re allowed to leave it unresolved.
Advance one candle at a time. Record the decision before revealing the outcome.
12. Chart-side checklist
Before the break: level marked · context TF chosen · next obstacle identified (Struct / session / VP edge).
After the break: completed FVG overlap? Pullback holding the zone? Opposing displacement? Still unresolved?
Before entry: exact trigger · stop defined · size from risk · room to objective after costs.
After entry: manage the plan you recorded. Don’t widen the stop to protect an opinion.
If you can’t explain why you’re entering in a couple of sentences, slow down.