MintScript Learn
Risk and Position Sizing: Survive First
The stop defines the risk. Decide cash risk first, size from stop distance plus costs, and never let liquidation beat your planned invalidation.
Decide the loss before the order A tight stop with a huge position can be riskier than a wide stop with a small position. The distance on the chart and the money at risk are different things.
Start with account equity, a chosen cash-risk budget, and the price where the trade is invalidated. Size comes after those decisions. The percentages below are arithmetic examples, not a recommendation for what you should risk.
For a linear instrument, approximate units equal cash risk divided by entry-to-stop distance times the cash value per price unit. Include expected entry and exit fees and an allowance for slippage. Round down to the permitted size increment. Contract types differ; inverse contracts need their own formula.
Work the numbers Example equity: $10,000. Illustrative risk: 0.25%, or $25. Entry 100, stop 98. Price risk is $2 per unit. Suppose estimated round-trip costs and slippage add $0.10 per unit. Size is 25 / 2.10 = 11.90 units. If the size step is one whole unit, round down to 11.
Planned loss is then about $23.10 under those assumptions. A gap or fast move can produce a larger realized loss. A stop order is not a guaranteed fill at the trigger price.
For a hypothetical futures contract worth $2 per index point, a 10-point stop is $20 per contract before costs. With $3 estimated round-trip costs, one contract uses $23 of a $25 budget. Two contracts would exceed it. Check the real contract specification before trading; don’t transplant this hypothetical multiplier.
Leverage changes margin, not the stop math If the position size and stop stay the same, increasing leverage doesn’t reduce the price loss at the stop. It changes the margin required and may change liquidation risk. A liquidation level before the planned stop makes the trade’s risk plan unusable.
Make sure you understand margin mode, collateral, and the instrument’s liquidation rules. Don’t treat a broker’s maximum available size as your allowed risk.
R makes trades comparable One initial R is the planned initial cash risk. A $50 profit on a trade with $25 initial risk is +2R. A $25 loss is −1R. Keep initial R fixed when evaluating a trade even if you later move the stop.
Expectancy is win rate times average winning R minus loss rate times average losing R, with net costs included consistently. Hypothetical example: 40% wins averaging +2R and 60% losses averaging −1R gives +0.2R per trade before any costs not already included. That arithmetic is not evidence your model achieves those inputs.
A losing streak is a sizing test After ten consecutive losses at 1% of then-current equity, $10,000 becomes about $9,043.82. At 5%, it becomes about $5,987.37. These examples assume every loss is exactly the risk fraction and exclude extra costs.
The point is to examine whether a plausible losing sequence would make you abandon the plan or struggle financially. A percentage that looks small on one trade can feel very different across a streak.
Add up the positions Long BTC, ETH, and SOL can share substantial directional exposure. Three positions don't automatically give you three independent risks. Add their planned losses and stress-test a move affecting all of them together; stops may slip at the same time.
Set a session loss limit before you start and specify whether it includes open risk. Don’t use “one more setup” to reset it. Review the limit with your strategy data later, away from a losing session.
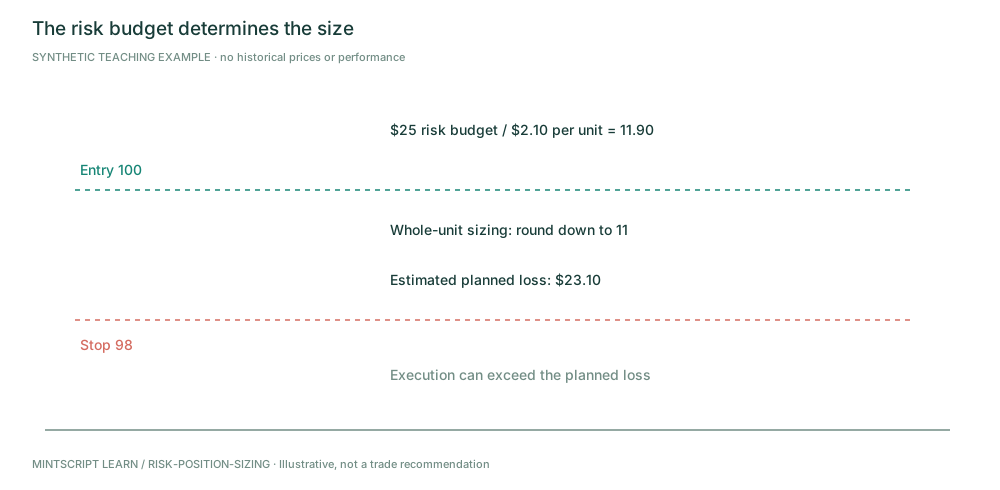
Costs are assumed in the example. Contract specifications and actual execution must be checked.
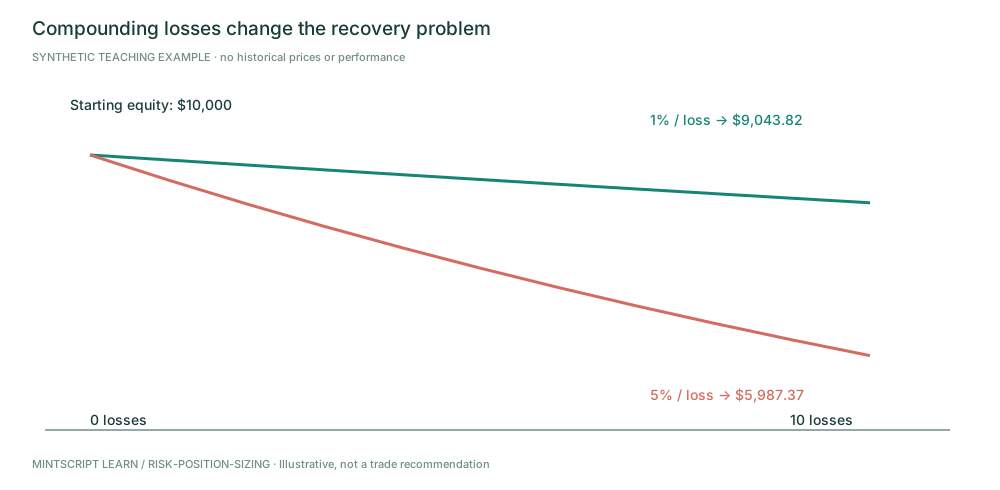
Exact arithmetic illustration; no estimate of the probability of ten losses. Additional costs excluded.
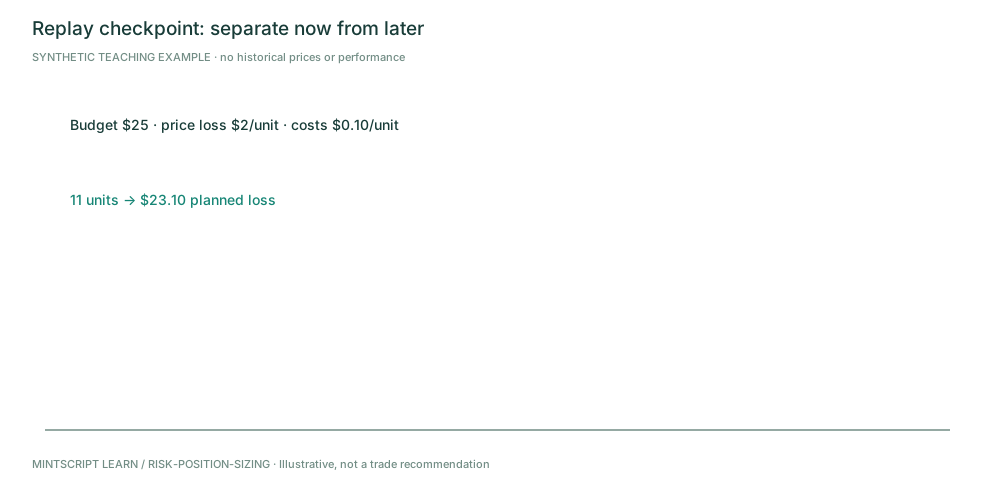
Hide the future. Describe what is known before revealing the later information.
Practice checkpoint
Cash-risk budget is $25. Each unit risks $2 at the stop plus $0.10 estimated costs. Whole units only. What is the maximum planned size?
Worked answer (peek after you decide): 11 units. 25 / 2.10 = 11.90, rounded down. Twelve would imply $25.20 planned loss, above the budget. Realized loss can still exceed the estimate if execution is worse.
Source and editorial notes
Original MintScript Learn framework. All charts and numerical examples are synthetic teaching paths — not historical trades, backtests, or performance claims. SMC / indicator labels use the explicit conventions in this lesson; they are not standardized market facts. No win rates or “institutional order” claims are asserted.
Desk features referenced: Struct · FVG · VP · Heat · Markets · ATR stops.