MintScript Learn
Multi-Timeframe Analysis Without the Noise
Give each chart one job — context, structure, trigger. Stop shopping lower timeframes until you find a yes.
Three charts, three jobs You can always find a bullish candle somewhere. That doesn’t mean you have a bullish setup. A useful timeframe process gives each chart a job so you stop changing the question whenever the answer is inconvenient.
For a practice template, use 4H for context, 1H for setup location, and 15-minute for the trigger. Those settings fit one workflow; they aren’t universally superior. The point is that the roles stay fixed long enough to evaluate them.
The context chart identifies the larger sequence and nearby obstacles. The setup chart defines the zone and potential invalidation. The trigger chart determines whether your entry condition actually occurred.
Context is a conditional scenario Instead of “4H is bullish, so buy,” write: “The selected 4H higher low remains intact. I’ll consider a 1H pullback into support if the 15-minute gives my rejection trigger. A close through the selected 4H low changes the context.”
Now you have a scenario with conditions. You also know what would make you stop looking for it.
A bullish context can contain a substantial bearish pullback. If your trade is designed to capture that pullback, label it countertrend relative to the context. Don’t quietly call it aligned because one smaller chart agrees.
Walk through a conflict Synthetic example: 4H has support at 100 and resistance at 120. Price pulls back from 118 to 106. On 1H, the pullback is a sequence of lower highs and lows. On 15-minute, you see a bullish break at 107.
That 15-minute break may be the first sign of a bounce. It doesn’t prove the 1H pullback has ended, particularly if its selected lower high at 110 is intact. If your model requires 1H confirmation, wait. If it allows an earlier entry at 4H support, price at 107 may not even be at your location yet.
The mistake is taking an early entry and then claiming you were waiting for confirmation all along.
Use only information available at the time A 4H candle that looks bullish halfway through can close bearish. If the model requires a 4H close, it needs that close. Replaying completed 4H bars while entering on earlier 15-minute candles can accidentally use future information.
Likewise, higher-timeframe pivots need their specified right-side candles to confirm. Record the time the signal became knowable, not just the time of the pivot itself.
Avoid the confluence illusion A 15-minute FVG and a 1H candle body can represent the same underlying move. Agreement across aggregated charts isn’t necessarily independent evidence. More labels don’t automatically multiply confidence.
Timeframe alignment is best treated as a filter you can test: compare aligned trades, countertrend trades, and unresolved context. Measure whether the filter improves outcomes after costs or simply removes opportunities.
Build a short pre-trade note Write four lines: context, location, trigger, invalidation. Include the nearest obstacle. If those lines contradict each other, resolve the conflict before sizing the trade.
And if the trigger chart says no, stop dropping down until something looks right. Waiting is a complete decision. You can remain bullish on the larger chart and have no long trade right now.
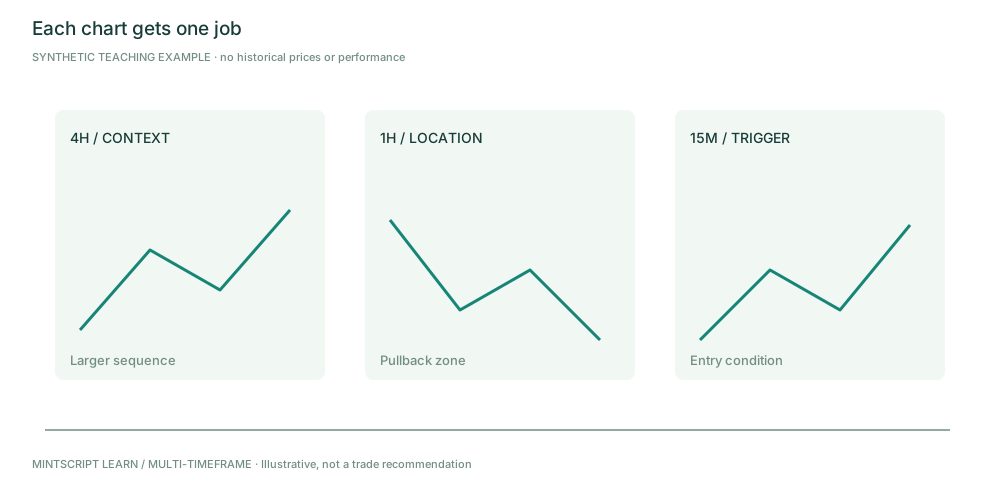
These panels illustrate roles, not synchronized historical candles.
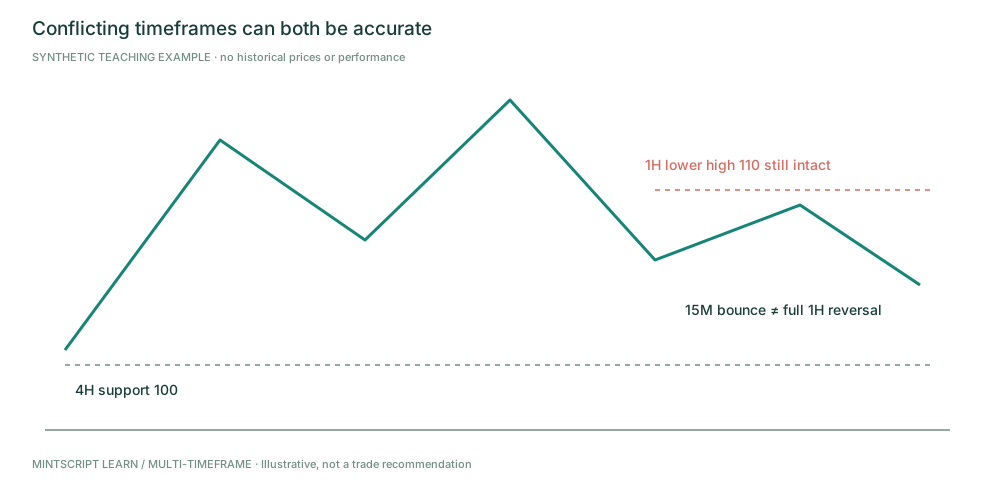
State which confirmation your model requires. One small break does not replace the missing conditions.
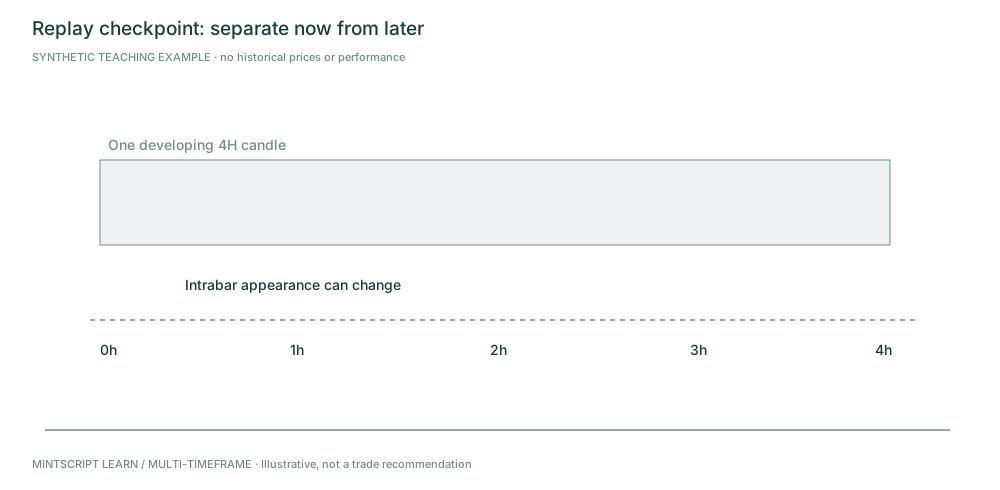
Hide the future. Describe what is known before revealing the later information.
Practice checkpoint
4H context is bullish, 1H pullback remains bearish, and 15-minute prints one bullish break. Must you take a long?
Worked answer (peek after you decide): No. Apply the entry model you chose. If it requires a 1H reversal or a visit to the 4H support zone, neither requirement is replaced by one 15-minute signal.
Source and editorial notes
Original MintScript Learn framework. All charts and numerical examples are synthetic teaching paths — not historical trades, backtests, or performance claims. SMC / indicator labels use the explicit conventions in this lesson; they are not standardized market facts. No win rates or “institutional order” claims are asserted.
Desk features referenced: Struct · FVG · VP · Heat · Markets · ATR stops.