MintScript Learn
VWAP: Read the Session, Not Just the Line
Above VWAP isn’t a buy signal. Learn trend vs rotation, pick anchors with a reason, and still require a price trigger at the location.
Above VWAP doesn’t mean buy Price can be above VWAP and already stretched into resistance. It can be below it and approaching a strong support area. Treat the line as a reference, then read how price behaves around it.
VWAP is cumulative price-times-volume divided by cumulative volume from a chosen starting point. A common bar-based version uses typical price, (high + low + close) / 3. Tick-based and bar-based calculations can differ. Check the source and reset settings before comparing charts.
Session VWAP resets at a defined session boundary. Anchored VWAP starts from a chosen event or candle. The choice of start point changes the result; it isn’t decoration.
Decide which session you mean For an equity index future, an overnight-inclusive session and the cash session produce different references. For crypto, a daily reset such as 00:00 UTC is a chosen convention, not a natural universal opening bell. Write the reset and timezone into your plan.
Volume is venue-specific. A crypto exchange’s VWAP reflects that exchange’s feed. Spot forex may provide tick volume rather than consolidated traded volume. Know what is actually weighting the line.
Trend day versus rotation day In a directional session, price may hold one side of a sloping VWAP and make limited pullbacks. Repeated crossings around a flatter VWAP describe a more rotational session. Those are observations that develop during the day, not labels you can know with certainty at the open.
One long model: price establishes above a rising VWAP, pulls back toward it near a previously marked support, then gives a bullish rejection trigger. The stop goes beyond the reaction structure. Check room to the next high before entering.
Failure case: price crosses VWAP eight times in a tight range. Buying every cross can turn one indecisive session into several losses. The line is telling you that your trend template may not fit.
A worked rotation example Synthetic prices: session VWAP is near 100, the range is 98–102, and price has crossed the line repeatedly. At 102, buying purely because price is above VWAP ignores the range ceiling.
A separate mean-reversion model might wait for rejection at 102 and consider 100 as a first objective. That is a different trade from a VWAP continuation long. It needs its own trigger and invalidation above the rejection swing. Don’t mix trend-following entries with mean-reversion exits mid-trade.
Anchor with a reason A major swing, an earnings event, or a clearly defined breakout can be an anchor candidate. Choose the event before judging whether the line held. Moving the anchor until it touches today’s low manufactures a result.
Two anchors can disagree because they summarize different intervals. That isn’t a signal to add five more. Write down what question each one answers: the current session, or the move since a specific event.
Bands are distances, not guarantees VWAP bands may use standard deviation or another method depending on settings. A second band isn’t an automatic reversal location. Strong trends can remain extended, and the distribution behind a band is not guaranteed to be normal.
Log slope, crossing frequency, reset, anchor, and location. Compare continuation days with rotation days. You’re trying to identify when the tool adds useful context, not make every candle obey an average.
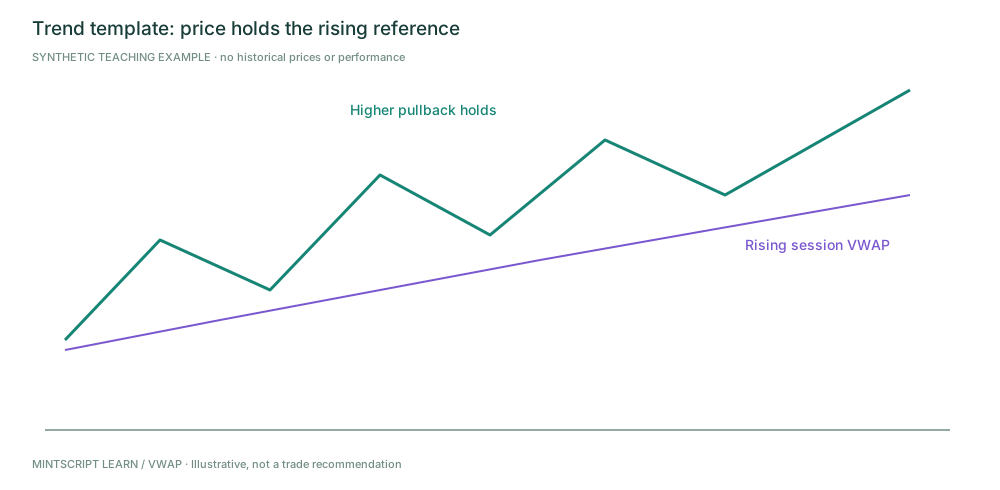
Stylized VWAP reference, not calculated market data. A price trigger is still required at the pullback.
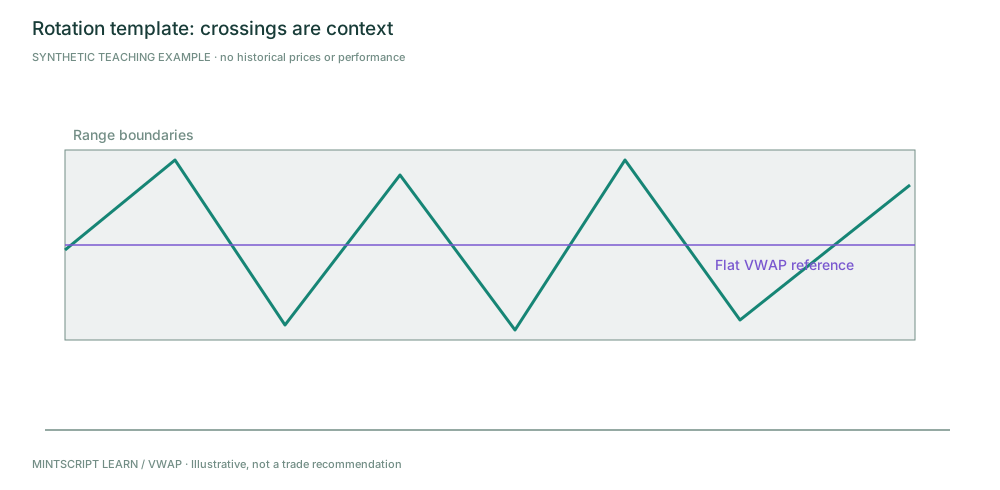
Repeated crossings don't qualify as repeated independent trend entries.
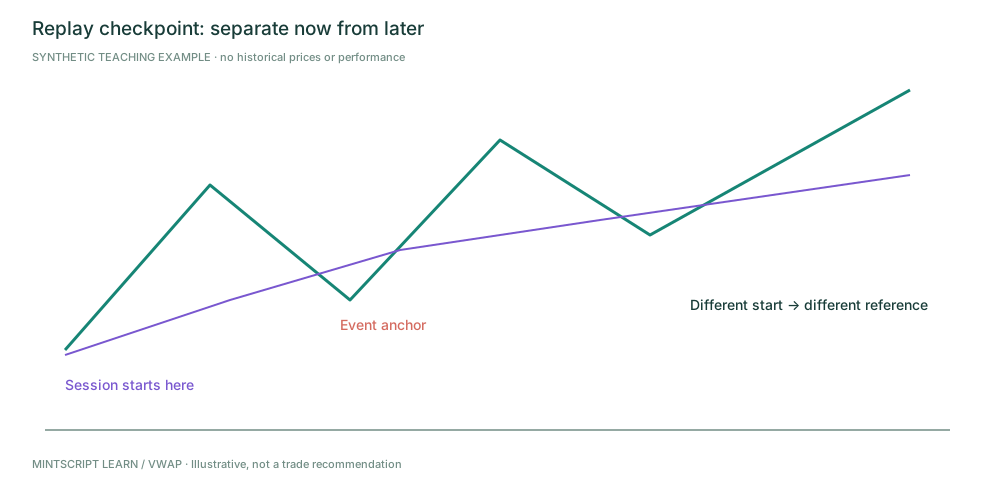
Hide the future. Describe what is known before revealing the later information.
Practice checkpoint
Price crosses a flat VWAP repeatedly and is now at range resistance. Is being above VWAP sufficient evidence for a continuation long?
Worked answer (peek after you decide): No. The repeated crossings indicate rotation in this example. A continuation model needs fresh evidence of acceptance and follow-through beyond resistance; above VWAP alone is insufficient.
Source and editorial notes
Original MintScript Learn framework. All charts and numerical examples are synthetic teaching paths — not historical trades, backtests, or performance claims. SMC / indicator labels use the explicit conventions in this lesson; they are not standardized market facts. No win rates or “institutional order” claims are asserted.
Desk features referenced: Struct · FVG · VP · Heat · Markets · ATR stops.