MintScript Learn
Volume and Momentum: What Is the Move Achieving?
Loud volume isn’t a thesis. Separate activity from directional intent, compare to a baseline, and still require a price trigger.
Start with the result A big volume bar looks important. First ask what price actually achieved. Did it clear resistance and hold, or trade enormous volume without making progress?
Volume measures activity on the feed you’re viewing. It doesn’t by itself tell you that buyers outnumber sellers: every executed trade has both sides. Aggressor-side data can describe which side crossed the spread, but even that doesn’t reveal every participant’s intent.
Crypto volume is fragmented across venues. A perpetual futures feed, a spot feed, and an aggregated feed can tell different stories. Spot forex tick volume counts updates rather than a consolidated global traded total. Write the source into your notes.
Compare like with like An opening-session volume spike compared with a quiet overnight candle may mostly reflect the clock. Compare against similar session times where possible. If you use a rolling average, state its length and recognize that it mixes different conditions.
For a simple practice metric, divide the current completed candle’s volume by the previous twenty completed candles’ average. A reading of 2 means twice that particular baseline. It doesn’t mean twice the conviction, and it doesn’t guarantee continuation.
Effort versus result High volume with little net price progress near resistance can suggest substantial two-way trading. Absorption is one possible explanation, but OHLCV candles alone cannot establish that a large passive seller absorbed aggressive buying.
For stronger absorption analysis, you’d need suitable trade or order-flow data and a defined rule. Even then, hidden liquidity, cancellations, and venue coverage limit what you can infer. In this lesson, call the candle observation “high activity, limited progress” unless you have the additional evidence.
Synthetic comparison: price moves from 100 to 101 on volume 1,000, then from 101 to 101.1 on volume 3,000. Activity rose while progress shrank. That is a reason to inspect location and follow-through. It is not a stand-alone short signal.
Exhaustion is an outcome, not a magic bar A sharp move on rising volume can be continuation or a climax. You usually need later price behavior to distinguish them. If the next pullback holds and the trend extends, calling the spike exhaustion was premature.
A reversal model might require failure to extend, a reclaim of a broken level, and an opposing structural trigger. Keep the volume observation separate from that trigger so you can test whether it adds anything.
RSI measures momentum, not cheapness RSI is a bounded momentum oscillator. Overbought doesn’t mean a short is due, and oversold doesn’t mean a long is safe. Strong trends can maintain extreme readings.
A bearish divergence pairs a higher price high with a lower RSI high using corresponding confirmed swings. Define the swing rule and indicator length before looking for examples. The divergence can persist while price keeps rising. Treat it as weakening momentum, not a reversal order.
Don’t draw an RSI line between unrelated peaks just to make it disagree with price. Also distinguish regular divergence from hidden divergence if you later add that separate concept.
Use a small evidence stack Location first. Price trigger second. Volume and momentum as optional filters. Record the trades with and without each filter rather than assuming three indicators are better than one.
The useful question is: did participation support meaningful progress at the place that mattered? That connects the indicator to the trade instead of letting the indicator invent the trade.
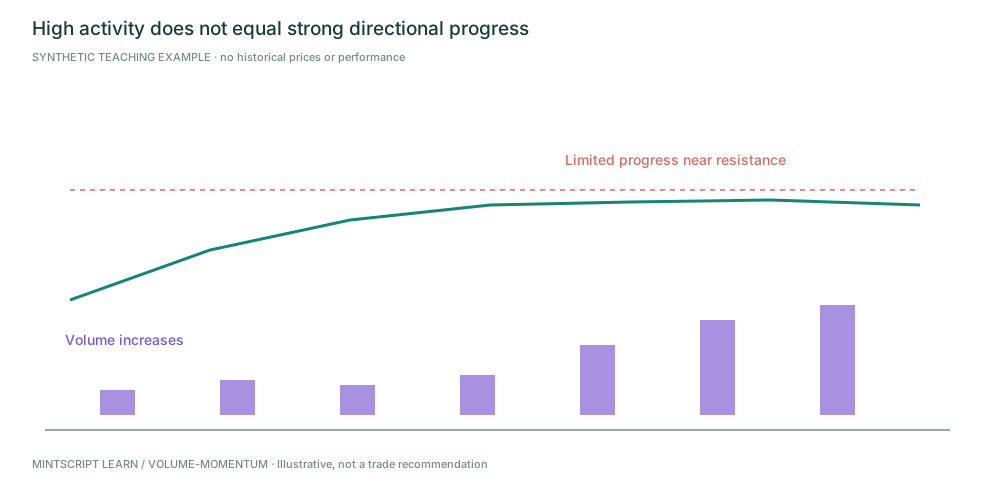
This candle observation alone does not prove absorption or identify the participants.
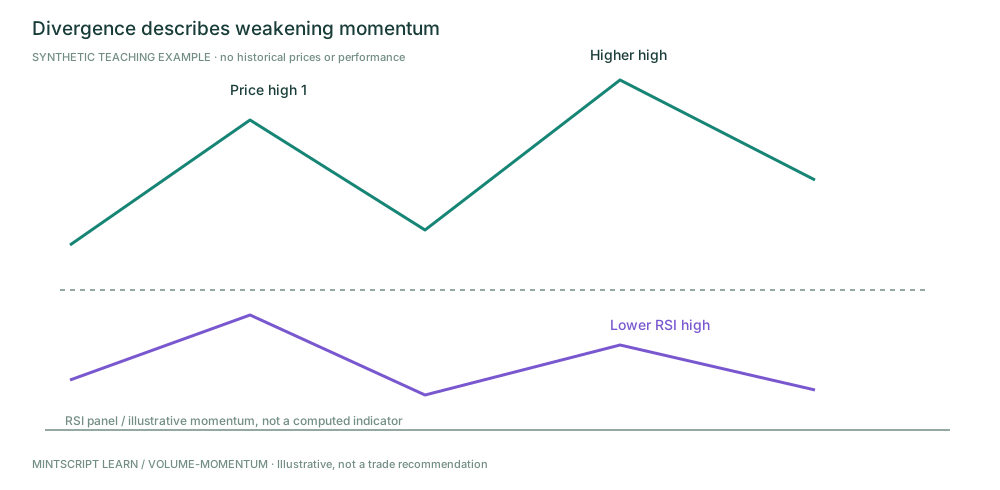
Use matching confirmed swings. Divergence is not a timing guarantee.
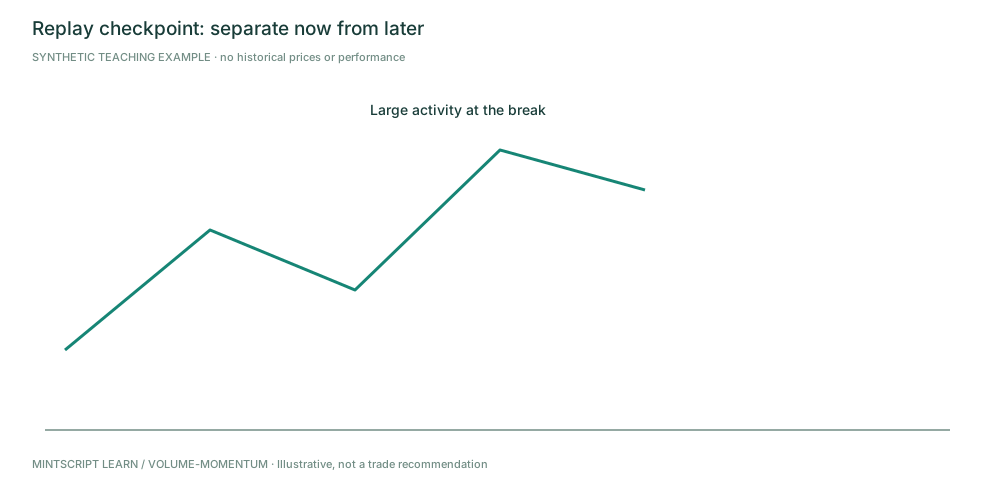
Hide the future. Describe what is known before revealing the later information.
Practice checkpoint
Price prints its highest volume bar at resistance but closes almost unchanged. Does that prove sellers absorbed buyers and a short will work?
Worked answer (peek after you decide): No. It shows high activity with little net progress. Absorption is an interpretation requiring more evidence. The next price response and your defined reversal trigger still matter.
Source and editorial notes
Original MintScript Learn framework. All charts and numerical examples are synthetic teaching paths — not historical trades, backtests, or performance claims. SMC / indicator labels use the explicit conventions in this lesson; they are not standardized market facts. No win rates or “institutional order” claims are asserted.
Desk features referenced: Struct · FVG · VP · Heat · Markets · ATR stops.